{
  const THREE = await import("https://esm.sh/three@0.160.0");
  const buf = await FileAttachment("cross-bar-to-piston-v3.stl").arrayBuffer();
  const dv = new DataView(buf);
  const n = dv.getUint32(80, true);
  const pos = new Float32Array(n * 9);
  let o = 84;
  for (let i = 0; i < n; i++) {
    o += 12;
    for (let v = 0; v < 3; v++) {
      const k = i * 9 + v * 3;
      pos[k] = dv.getFloat32(o, true);
      pos[k + 1] = dv.getFloat32(o + 4, true);
      pos[k + 2] = dv.getFloat32(o + 8, true);
      o += 12;
    }
    o += 2;
  }
  const geo = new THREE.BufferGeometry();
  geo.setAttribute("position", new THREE.BufferAttribute(pos, 3));
  geo.computeVertexNormals();
  geo.center();
  geo.computeBoundingSphere();
  const rad = geo.boundingSphere.radius;
  const W = 256, H = 264;
  const scene = new THREE.Scene();
  const cam = new THREE.PerspectiveCamera(38, W / H, 0.1, rad * 100);
  cam.position.set(0, 0, rad * 3.3);
  const mesh = new THREE.Mesh(geo, new THREE.MeshStandardMaterial({ color: 0x6f86ad, metalness: 0.2, roughness: 0.5, flatShading: true }));
  scene.add(mesh);
  scene.add(new THREE.AmbientLight(0xffffff, 0.6));
  const key = new THREE.DirectionalLight(0xffffff, 0.9); key.position.set(1, 1, 1.2); scene.add(key);
  const fill = new THREE.DirectionalLight(0xffffff, 0.3); fill.position.set(-1, 0.4, -0.6); scene.add(fill);
  const rnd = new THREE.WebGLRenderer({ antialias: true, alpha: true });
  rnd.setPixelRatio(devicePixelRatio);
  rnd.setSize(W, H);
  const dom = rnd.domElement;
  dom.style.cursor = "grab"; dom.style.touchAction = "none"; dom.style.maxWidth = "100%";
  let ry = 0.6, rx = -0.35, drag = false, lx = 0, ly = 0, auto = true;
  dom.addEventListener("pointerdown", e => { drag = true; auto = false; lx = e.clientX; ly = e.clientY; dom.setPointerCapture(e.pointerId); dom.style.cursor = "grabbing"; });
  dom.addEventListener("pointermove", e => { if (!drag) return; ry += (e.clientX - lx) * 0.01; rx += (e.clientY - ly) * 0.01; lx = e.clientX; ly = e.clientY; });
  dom.addEventListener("pointerup", () => { drag = false; dom.style.cursor = "grab"; });
  let raf;
  (function loop() { if (auto) ry += 0.004; mesh.rotation.set(rx, ry, 0); rnd.render(scene, cam); raf = requestAnimationFrame(loop); })();
  invalidation.then(() => { cancelAnimationFrame(raf); rnd.dispose(); });
  return html`<div style="border:1px solid rgba(128,128,128,.22);border-radius:12px;padding:8px;background:rgba(127,168,208,.06)">${dom}</div>`;
}Vertical climbing assay rig
A climbing assay reads out motor function through negative geotaxis: knock a fly to the floor of a vertical chamber and it climbs, and how it climbs — its speed, height, falls and pauses — reports on the motor circuitry driving the behaviour. The classic version is done by hand: tap a vial of flies and count how many pass a line in a set time. That is enough to catch gross motor deficits, but manual tapping agitates every fly a little differently, it leaves no precise moment to synchronise light or tracking to, and a single pass-or-fail line throws away the shape of the climb.
That gap is what this rig was built to close. To measure Drosophila climbing under optogenetic control in my thesis, I needed to agitate every fly the same way, every trial, and hand off cleanly to timed light stimulation and frame-by-frame tracking. So I built a chamber and, around it, an automated rig that made the startle reproducible and locked it to the optogenetics. The pneumatic and electronics build was done in collaboration with the Duke-NUS 3D Printing & Prototyping (3DPP) Lab; credit to Dennis Ong, who built the fabrication and microcontroller side.
The apparatus
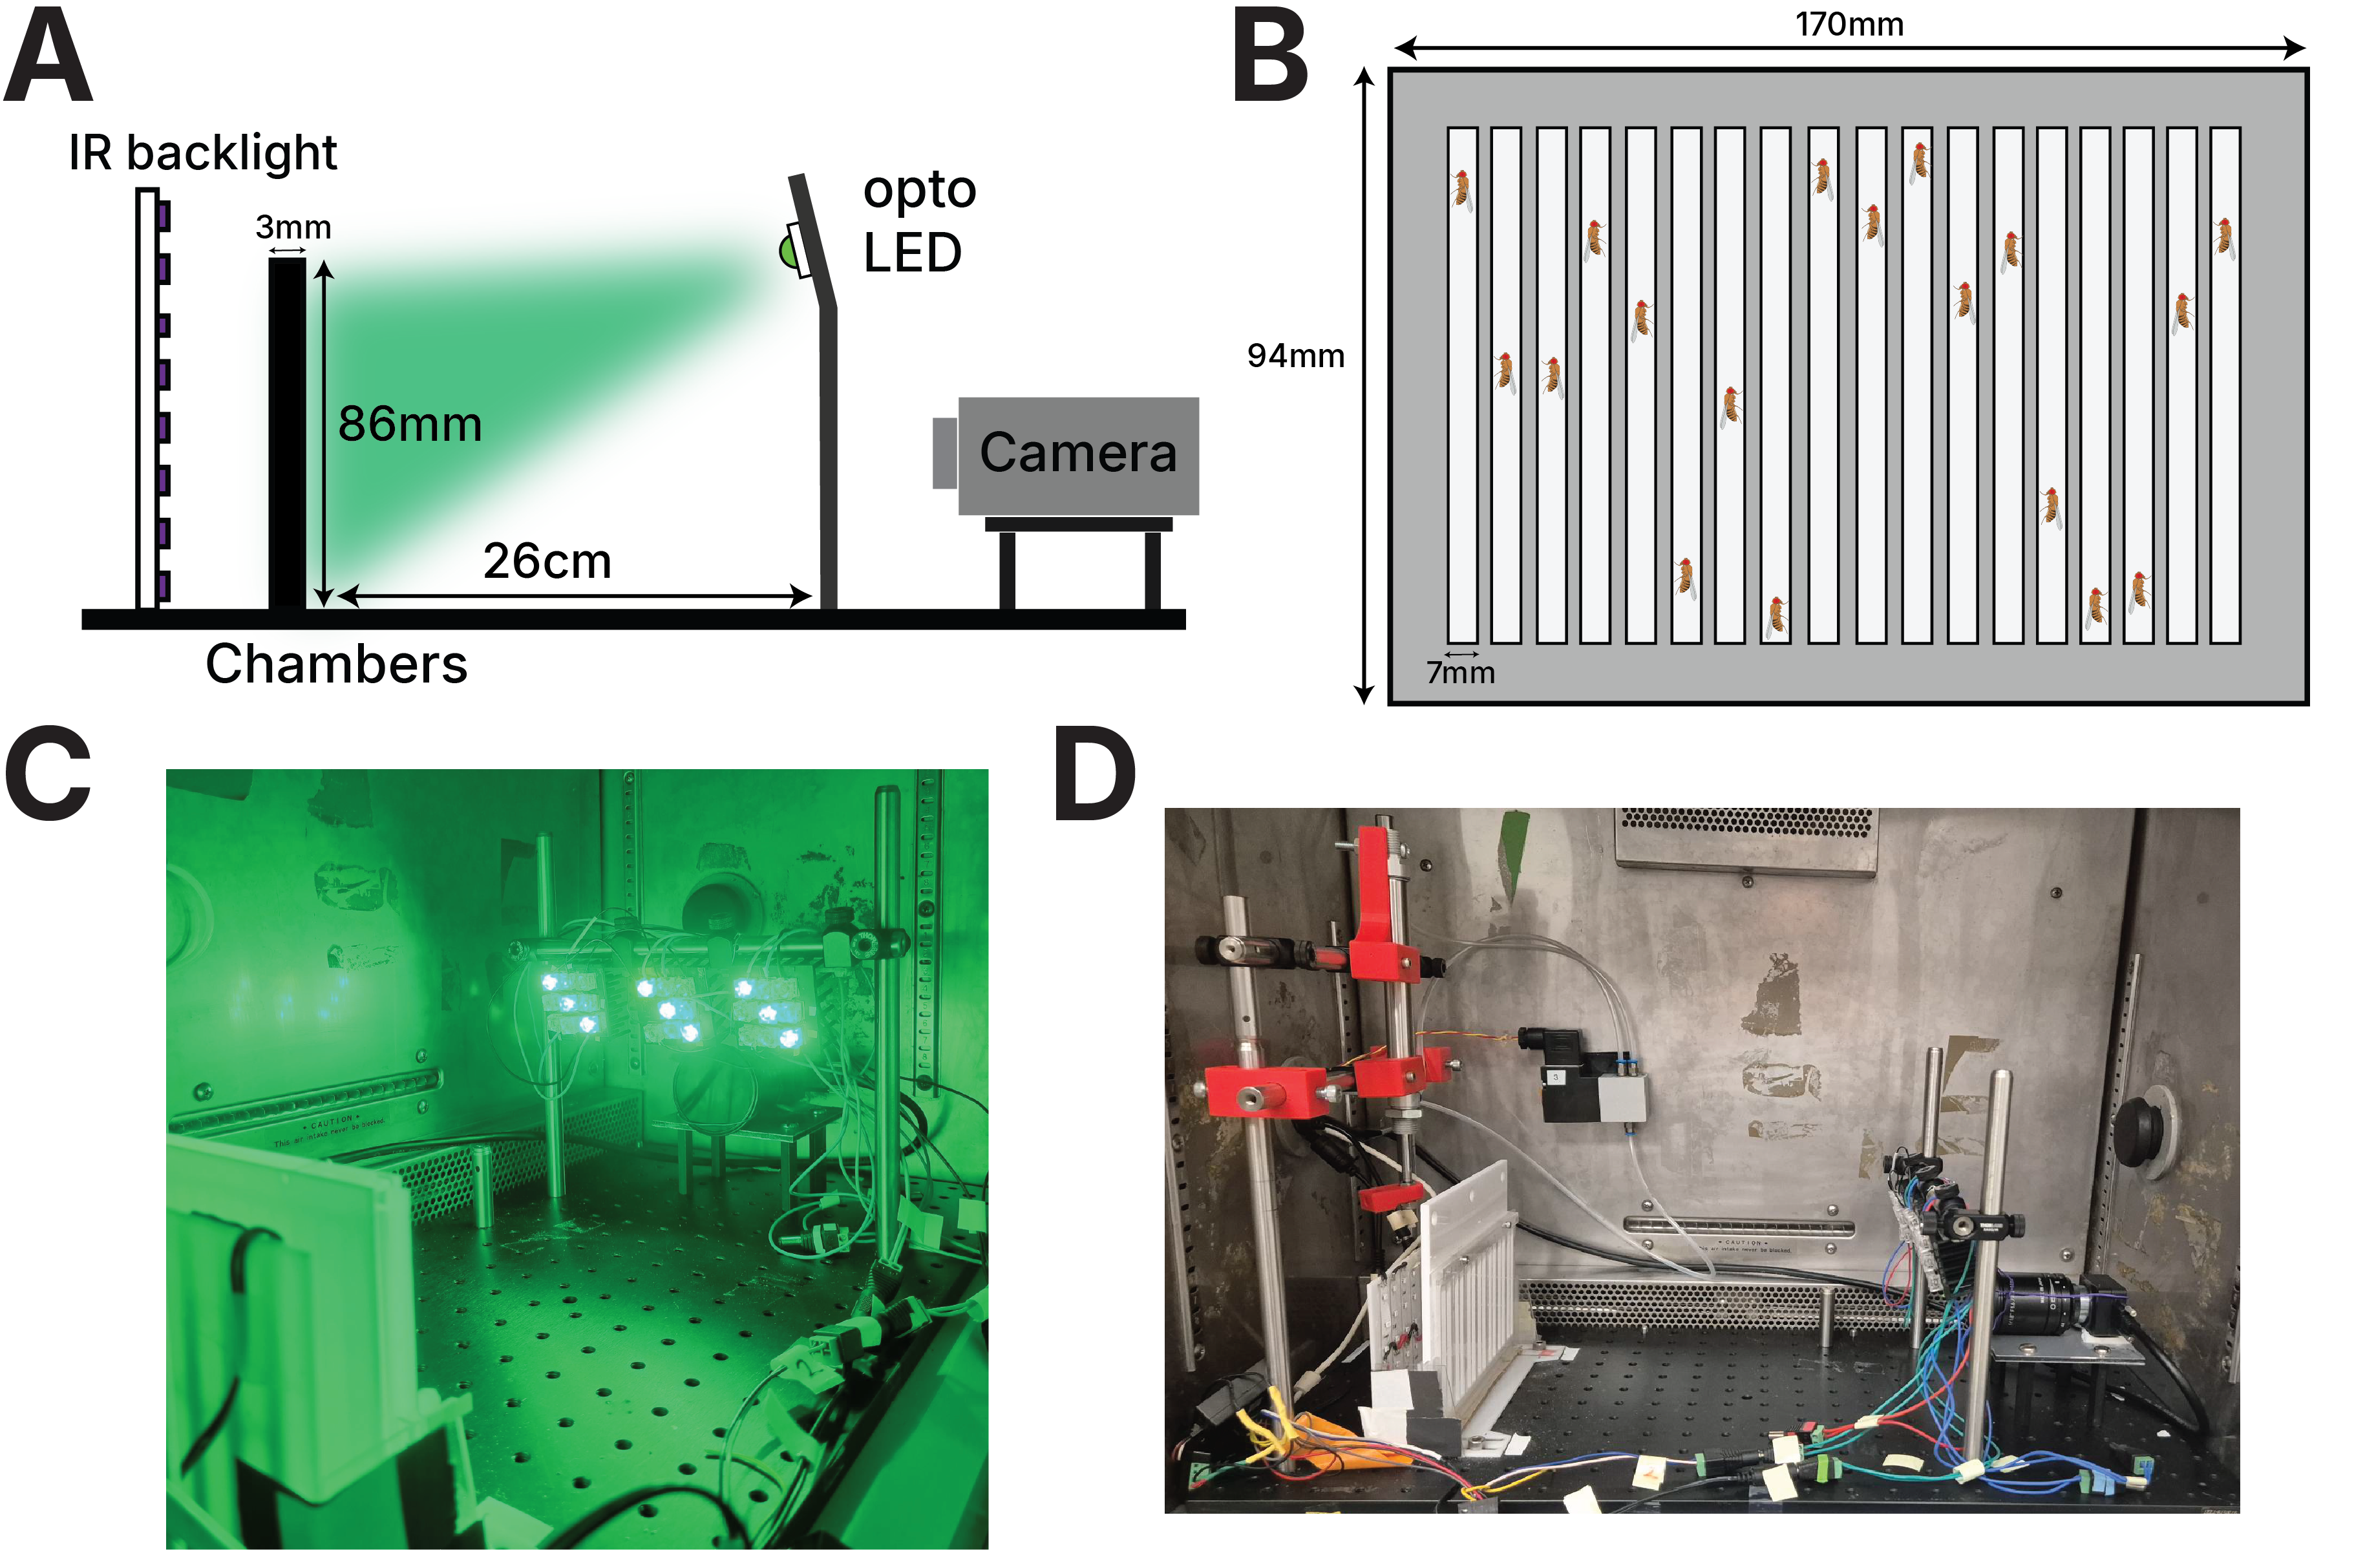
Figure 1. Climbing assay apparatus. (A) Schematic of the setup: an IR backlight for the light-off phase, the fly-chamber cassette, the optogenetic LEDs, and the camera. (B) Diagram of the climbing cassette with 17 individual lanes, each housing a single fly. (C) The rig during optogenetic stimulation under green LED illumination. (D) The automated rig with the pneumatic agitation system.
Climbing behaviour is assessed in a custom acrylic cassette (170 × 94 × 9 mm) holding 17 individual chambers (7 W × 86 H × 3 D mm), CNC-milled into a 3 mm transparent acrylic sheet mounted onto a white acrylic diffuser (Figure 1B). One fly per lane keeps individuals in frame and physically separated, so seventeen animals can be recorded at once without ever crossing paths, and the tall, narrow geometry defines a repeatable climb. Flies are briefly anaesthetised on ice for 30 s, loaded one to a chamber, and given 3 minutes to recover before any testing begins.
Illumination and imaging
Optogenetic stimulation can be delivered in green (530 nm), blue (460 nm), or red, with intensity adjustable up to ~20 µW/mm². The low, tunable intensities suit light-sensitive opsins requiring minimal activation. The whole assembly sits inside a temperature-controlled incubator.
Automated pneumatic agitation
One of the components cut out for the rig — the cross-bar-to-piston adapter. Drag to rotate.
Every recording set starts by displacing all seventeen flies to the bottom of their chambers. I did this by hand at first, tapping the cassette down, but manual tapping introduced inconsistent delays between the flies resetting and the start of tracking and light, which is exactly the temporal precision an optogenetic experiment cannot afford to lose. So I replaced it with a pneumatic system (Figure 1D) that agitates the same way every time and hands off cleanly to the recording.
The cassette mounts to an acrylic backboard via a single-acting pneumatic piston, held by 3D-printed adapters on optical posts to stay rigidly aligned and damp vibration. Compressed air reaches the piston through a normally-closed solenoid valve with a manual emergency release. An Arduino UNO (programmed by Dennis Ong, 3DPP Lab) controls actuation, with an OLED and rotary encoder to set parameters. Tracking pauses during agitation and resumes only once every fly is confirmed back on the chamber floor, since a stroke occasionally fails to dislodge one.
The chambers in action
Video 1. A recording from the cassette. Individual flies climbing their lanes, the footage the tracker works from frame by frame.
Tracking and analysis
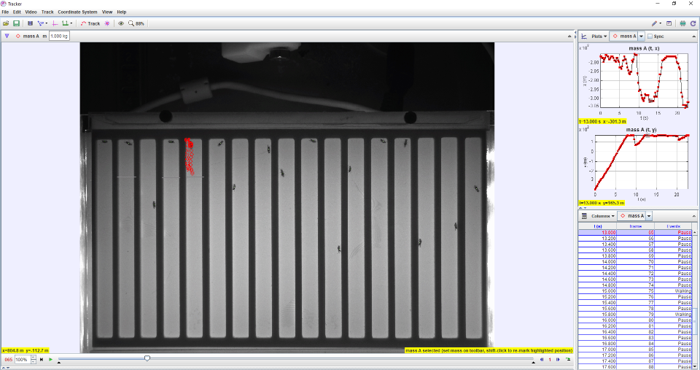
Figure 2. Ground-truth annotation in Tracker.
Video and positions are processed in real time by CRITTA, a tracker that segments flies from the background by subtraction, giving x–y coordinates per fly per frame. I then wrote a custom Python package, DrosoClimb, to turn those raw tracks into behaviour: it converts coordinates to millimetres, splits each trial into its dark, light and recovery phases, and classifies every frame as walking, pausing or falling. Those thresholds come from ground truth I hand-labelled in Tracker (Figure 2). From there it computes a range of climbing metrics, each reported as a DABEST effect size, together building an ethomic profile of the fly’s motor behaviour.
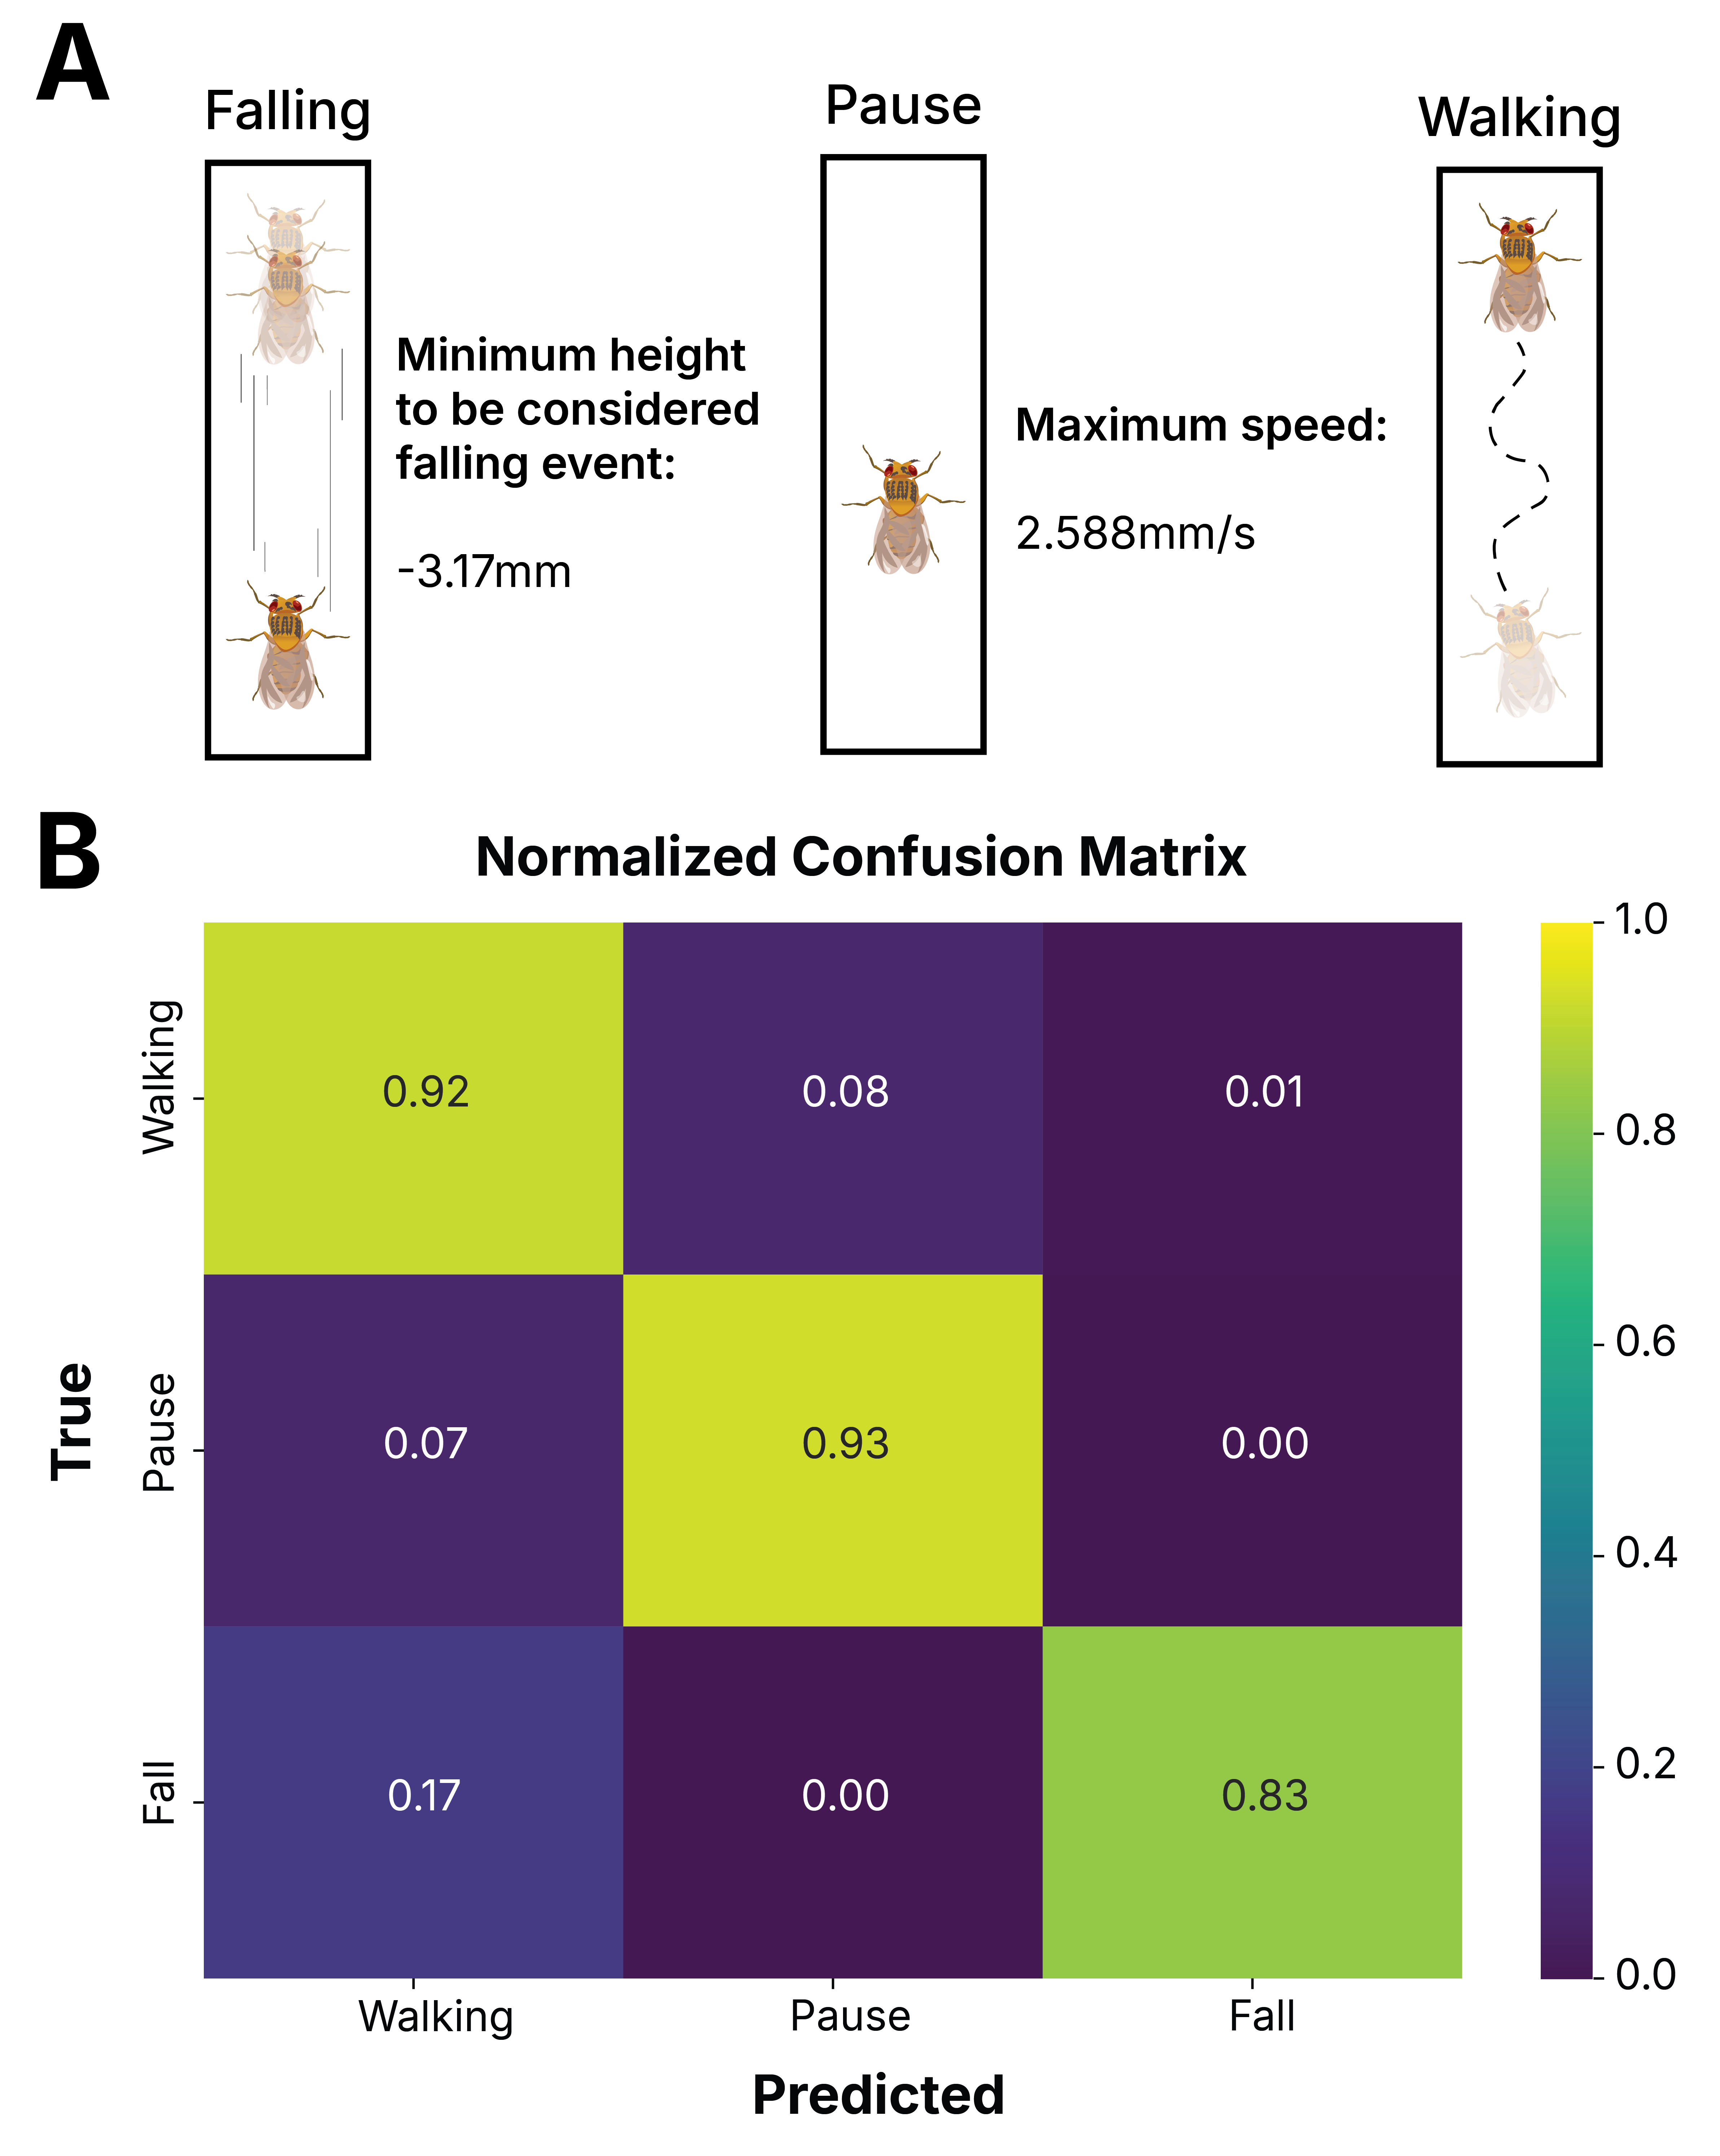
Figure 3. Behavioural event classification. (A) the states and thresholds; (B) the test-set confusion matrix.
Every frame is scored against thresholds fixed on hand-labelled training video (17 flies, 1,810 frames, top and bottom 10% trimmed): a fall is a downward jump beyond −3.17 mm per frame, a pause is a speed below 2.588 mm/s, and anything faster without a fall is a walk. On an independent test set (13 flies, 1,477 frames) the classifier reads 92% of walking, 93% of pause and 83% of fall frames correctly.
See the science this rig was built for → the KCR and OPN3 studies.