drugbase = ("Drug target sample files/" if __import__("os").path.isdir("Drug target sample files") else "../Drug target sample files/")
flu = pd.read_csv(drugbase + "1. FLUOXETINE_sample.csv")["Gene names"].dropna().tolist()
ibu = pd.read_csv(drugbase + "2. IBUPROFEN_sample.csv")["Gene names"].dropna().tolist()
acet = pd.read_csv(drugbase + "3. ACETAMINOPHEN_sample.csv")["Gene names"].dropna().tolist()UpSet (static)
UpSet plot (any number of sets): intersection bars, dot matrix and set totals, with members listed inside each bar.
upset
def upset(
    data_dict, color_list:NoneType=None, bar_width:float=0.8, totals_bar_height:float=0.6, matrix_height:float=1.0,
    intersection_plot_elements:int=6, totals_plot_elements:int=2, circle_size:int=100, gridkey_fontsize:int=13,
    axis_fontsize:int=13, fontsize:NoneType=None, count_fontsize:int=12, count_color:NoneType=None,
    min_fontsize:int=6, max_fontsize:int=20, figsize:NoneType=None, font:str='Inter', sort_by:str='cardinality',
    wspace:int=0, hspace:int=0, title:str='', title_fontsize:int=20, title_fontweight:str='bold',
    save_path:NoneType=None
):
Call self as a function.
Data
UpSet takes a plain {name: [members]} dict.
Static UpSet
upset({"Fluoxetine": flu, "Ibuprofen": ibu, "Acetaminophen": acet}, figsize=(11, 6), color_list="Set2", wspace=0.55)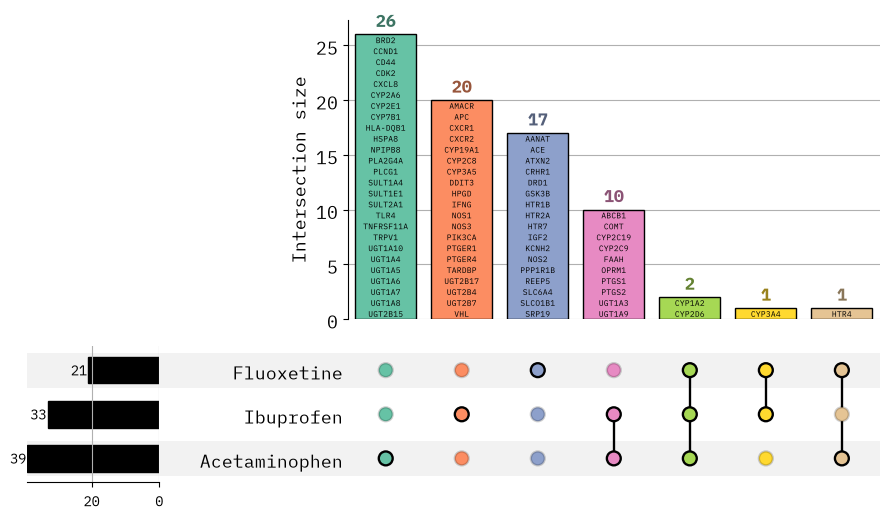
Controlling plot aesthetics
| Argument | Controls |
|---|---|
color_list |
list of bar colours, or a colormap name (e.g. "Set2"); one per intersection bar |
title, title_fontsize |
figure title text and size |
count_color, count_fontsize |
colour and size of the count above each bar (default colour: a darkened bar colour) |
fontsize |
force a fixed member font (default: auto-fit to the bars) |
min_fontsize, max_fontsize |
bounds for the automatic font search |
circle_size |
size of the dot-matrix markers |
gridkey_fontsize, axis_fontsize |
font sizes of the set names and the axes |
bar_width, totals_bar_height |
thickness of the intersection and set-total bars |
sort_by |
order bars by "cardinality" or "degree" |
wspace, hspace |
spacing between the panels |
figsize, save_path |
figure size, and an optional path to save a 300-dpi PNG |
Colormap names. Any Matplotlib colormap name works for color_list; qualitative maps keep the sets/bars most distinct: Set1, Set2, Set3, Dark2, Paired, Accent, Pastel1, Pastel2, tab10, tab20. You can also pass an explicit list of colours instead.