drugbase = ("Drug target sample files/" if __import__("os").path.isdir("Drug target sample files") else "../Drug target sample files/")
flu = load(drugbase + "1. FLUOXETINE_sample.csv", "Gene names", "Fluoxetine")
ibu = load(drugbase + "2. IBUPROFEN_sample.csv", "Gene names", "Ibuprofen")
acet = load(drugbase + "3. ACETAMINOPHEN_sample.csv", "Gene names", "Acetaminophen")Venn (static)
Area-proportional Euler/Venn diagram (2-3 sets) with itemised member labels, via eunoia.
eunoia_venn
def eunoia_venn(
    dfs, colors, style:str='round', fontsize:NoneType=None, inner_label_size:NoneType=None,
    outer_label_size:NoneType=None, title_size:NoneType=None, font:str='Inter', fontcolor:str='black',
    count_color:NoneType=None, title:str='', num_cols:NoneType=None, gutter:int=2, margin:float=0.03,
    min_fontsize:int=6, max_fontsize:int=40, grid:int=380, seed:int=0, figsize:NoneType=None,
    save_path:NoneType=None
):
Call self as a function.
Data
Static Venn / Euler
Round style (circle for 2 sets, ellipse for 3), members auto-fit inside each region.
eunoia_venn([ibu, acet], colors="Set1", figsize=(8, 6.5), title="Ibuprofen vs Acetaminophen targets")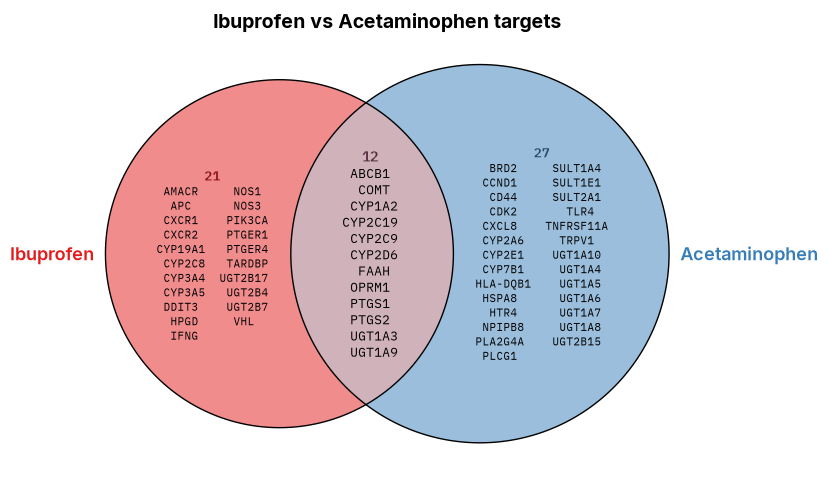
eunoia_venn([flu, ibu, acet], colors="Set1", figsize=(9, 8), title="Targets of Fluoxetine, Ibuprofen, Acetaminophen")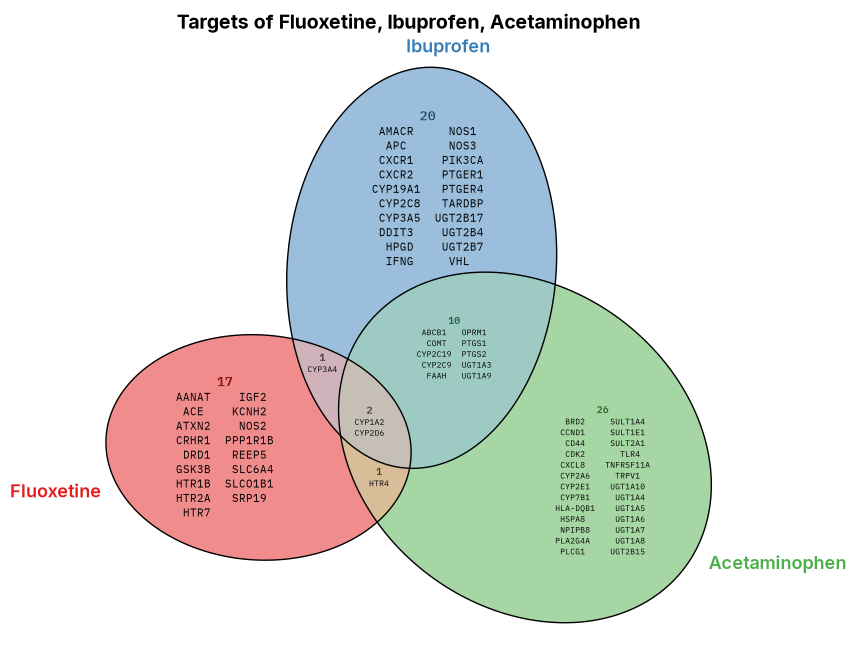
import sys, viset.venn as v, inspect
print(sys.executable)
print(v.__file__)
print("has fix:", "closest to the region centroid" in inspect.getsource(v._max_font_rect))
/opt/hostedtoolcache/Python/3.11.15/x64/bin/python
/home/runner/work/VISET/VISET/viset/venn.py
has fix: TrueVISET also has a box style (style="box" — squares for two sets, rectangles for three). As the Introduction explains, rectangles can make all seven regions of a three-set diagram exactly area-proportional, but eunoia packs them tightly, so the itemised member lists have little room and read poorly. The round (ellipse) style shown above is recommended whenever you want the member names inside the regions; use style="box" mainly for the area-exact shapes themselves.
eunoia_venn([flu, ibu, acet], colors="Set1", figsize=(9, 8), style = "box", title="Targets of Fluoxetine, Ibuprofen, Acetaminophen")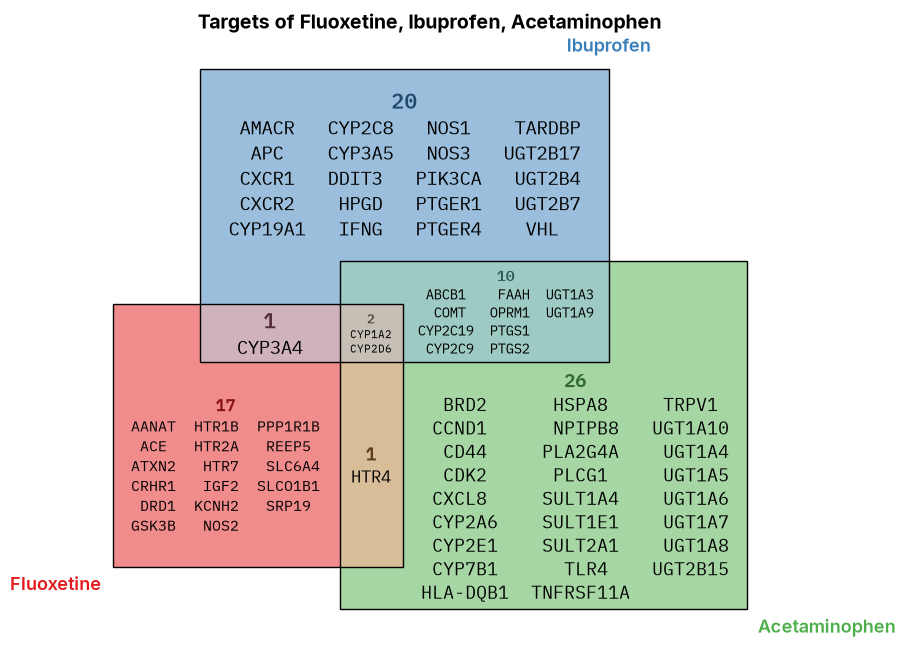
Controlling plot aesthetics
| Argument | Controls |
|---|---|
style |
"round" (circle for 2 sets, ellipse for 3) or "box" (square / rectangle) |
colors |
list of colours, or a Matplotlib colormap name (e.g. "Set1", "Dark2") |
title, title_size |
figure title text and size |
count_color |
colour of the intersection count numbers (default: a darkened blend of the region’s set colours) |
fontcolor |
colour of the member-name text |
outer_label_size |
font size of the set names placed outside each shape |
num_cols |
force a fixed number of member columns per region (default: chosen automatically) |
fontsize |
force a fixed member font (default: auto-fit per region) |
min_fontsize, max_fontsize |
bounds for the automatic font search (defaults 6 and 40) |
gutter |
blank spaces between member columns |
margin |
fraction of the fitted box kept clear, so the outline never touches the text |
figsize, save_path |
figure size, and an optional path to save a 300-dpi PNG |
Colormap names. Any Matplotlib colormap name works for colors; qualitative maps keep the sets/bars most distinct: Set1, Set2, Set3, Dark2, Paired, Accent, Pastel1, Pastel2, tab10, tab20. You can also pass an explicit list of colours instead.